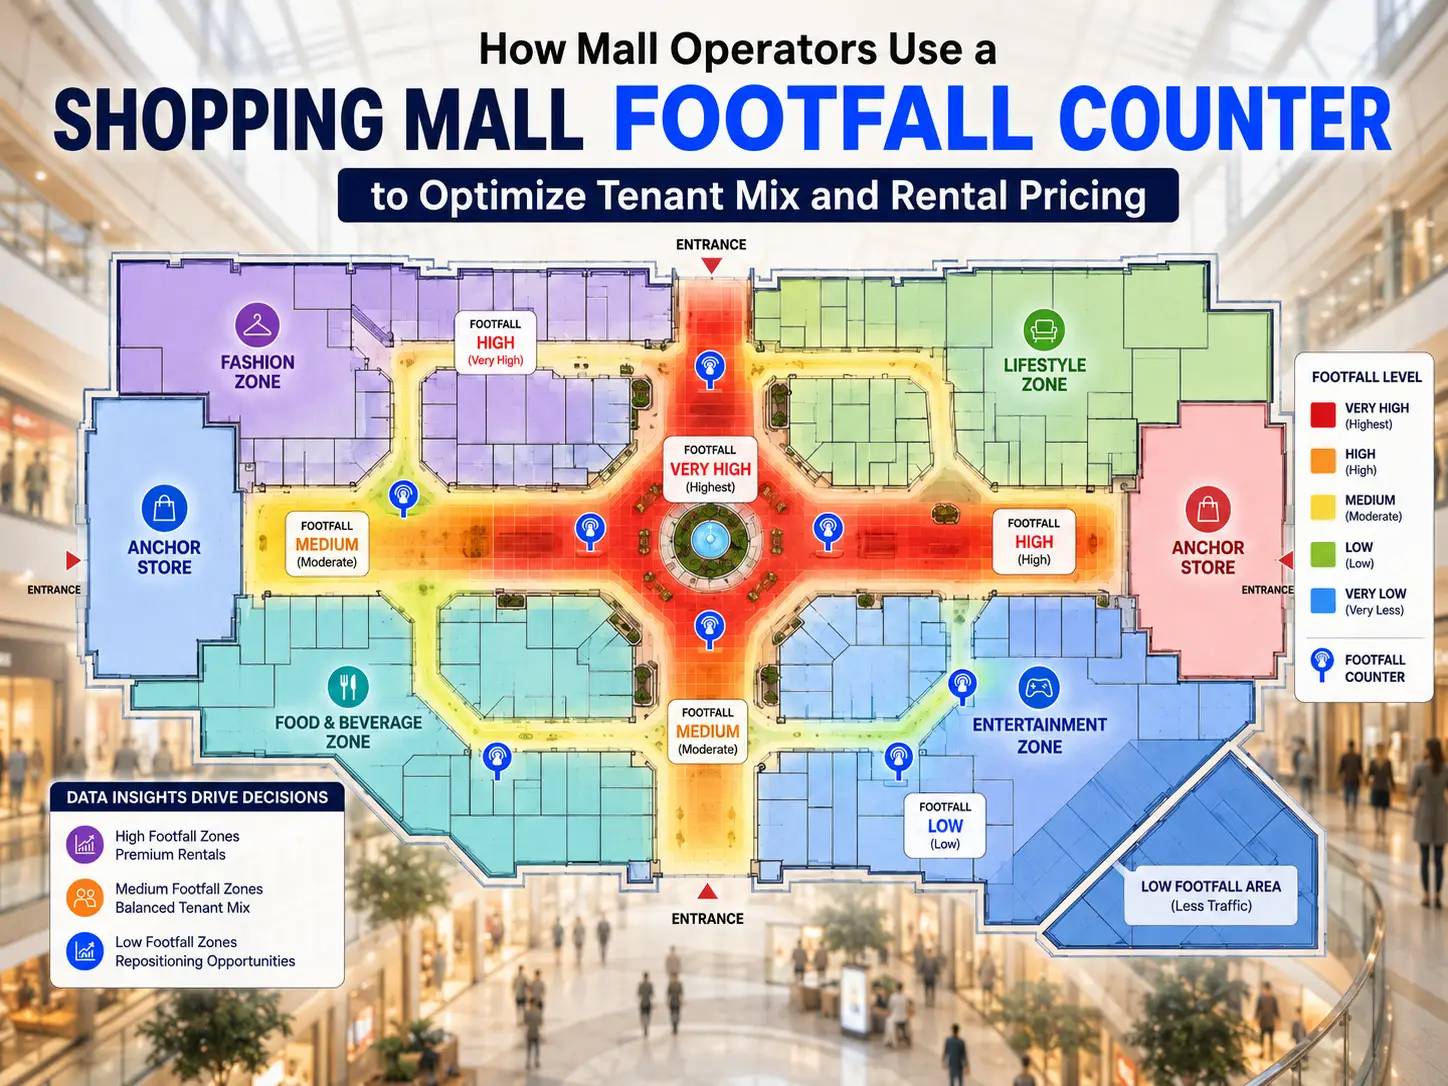
A shopping mall footfall counter is most valuable when it does more than count entrances. Mall operators use mall footfall analytics to measure zone traffic, dwell time, repeat movement, and tenant conversion patterns, then apply those insights to leasing, space allocation, and rental negotiations. This guide explains how to implement that process step by step so the data becomes commercial intelligence rather than another dashboard.
In practical terms, the outcome is straightforward: better tenant placement, stronger evidence for premium rent in high-exposure corridors, and more disciplined decisions about underperforming zones. A modern people counting system for malls should support entrance counting, corridor analysis, occupancy visibility, and integration with sales and operational systems.
What is a shopping mall footfall counter? It is a sensor-based system that measures visitor movement through entrances, corridors, and defined zones using technologies such as 3D stereoscopic counting, AI video analytics, LiDAR, or Wi-Fi-based detection. Unlike basic traffic counting, enterprise mall deployments are designed to produce decision-grade shopping mall traffic analysis for leasing and operations teams.
Step 1: Define the commercial questions before installing sensors
Start with the leasing and asset-management questions you want the data to answer. Common examples include: which corridors justify premium rent, which units receive strong traffic but convert poorly, and which dead zones should be reallocated to F&B, pop-up retail, or experiential use. If those questions are not defined first, even an accurate counting system will create interesting reports without commercial action.
For mall operators, the best starting framework is to separate objectives into four categories:
- Leasing: support mall rental pricing based on footfall and exposure
- Tenant mix: identify category adjacencies that improve cross-shopping
- Operations: align staffing, cleaning, security, and HVAC to actual density
- Marketing: measure campaign uplift, event traffic, and annual footfall trends
This is also the stage to decide whether you need only entrance counts or a full zone-based solution. Many operators begin with main-door data and later discover they cannot explain why one atrium outperforms another. A proper brief should identify entrances, anchor approaches, escalator lobbies, event spaces, and transition corridors as separate measurement points.
Practical tip: define success metrics in advance, such as lease renewal evidence packs, tenant benchmarking reports, and weekly zone heatmaps. Common mistake to avoid: approving a mall-wide deployment before agreeing who owns the analytics output—leasing, operations, or marketing.
Step 2: Choose the right measurement technology for each mall zone
Not every area in a shopping center should be measured the same way. Main entrances often require high-accuracy overhead sensors, while broad atriums and multi-directional corridors may need 3D stereo or LiDAR-based devices that can distinguish overlapping traffic flows. Wi-Fi tracking can add journey insights, but it should not be treated as the primary source for corridor counts because detection depends on device discoverability rather than confirmed physical passage.
For many projects, operators compare solutions such as the Footfall counting system solutions range, including the FootfallCam 3D Pro2 for precise overhead counting and the Pro1 AI powered counter where mounting conditions or use cases differ. The right architecture usually combines entrance counters, zone sensors, and analytics software rather than relying on one device type for the entire property.
How the main technologies compare
| Technology | Best use in malls | Strengths | Limitations |
|---|---|---|---|
| 3D stereoscopic counter | Main entrances, corridors, escalator approaches | High directional accuracy, strong performance in variable light, reliable physical counts | Needs correct mounting height and calibration |
| AI video counter | Smaller zones, stores, temporary analytics points | Flexible deployment, useful for queue and occupancy analysis | Performance depends on scene complexity and camera angle |
| LiDAR | Wide open areas, complex paths, high ceilings | Strong pathing and spatial tracking capabilities | Higher design complexity and cost |
| Wi-Fi tracking | Journey trends, repeat visit patterns | Useful supplementary behavioral signal | Not ideal as a standalone source for exact visitor counts |
Practical tip: run a site survey at different times, including weekends and event peaks. Common mistake to avoid: choosing devices purely by price without checking ceiling height, line-of-sight, corridor width, and directional flow requirements.
Step 3: Map the mall into measurable zones and standardize the KPIs
Once the hardware approach is clear, translate the building into analyzable commercial zones. Mall operators usually need more than entry traffic; they need exposure by level, corridor, anchor adjacency, event area, food court, and low-performing pockets. A good zone map allows the team to compare visitor flow between spaces that compete for rent, promotion budget, or redevelopment attention.
The most useful mall footfall analytics KPIs are:
- Visitor count: total traffic by entrance, level, or corridor
- Directional flow: where people came from and where they moved next
- Dwell time: how long visitors remain in a zone
- Capture rate: proportion of corridor traffic entering a tenant or event area
- Occupancy: real-time density for operations and safety
- Repeat visit patterns: frequency and return behavior where supported
- Conversion: traffic-to-sales ratio when tenant POS data is available
Direct buyer question: What metrics should mall managers track besides visitor counts? The answer is dwell time, directional flow, capture rate, occupancy, and conversion. These metrics reveal whether a unit has an exposure problem, a merchandising problem, or a staffing problem—three very different actions.
To keep reports credible, define measurement windows consistently. For example, compare weekday lunch traffic to the same period across zones, not to total daily traffic from another entrance. Practical tip: create a data dictionary so leasing, marketing, and operations use the same KPI definitions. Common mistake to avoid: reporting raw counts without normalizing for trading hours, event days, or closed-unit periods.
Step 4: Connect traffic data to tenant mix decisions and space planning
Tenant mix optimization using footfall data works when operators move from descriptive reporting to placement strategy. If high-end fashion generates long dwell time and premium corridor exposure, nearby beauty, accessories, or fine gifting categories may benefit from adjacency. If a family zone draws strong weekend traffic but weak weekday dwell, the answer may be fast-casual dining, services, or play concepts rather than another apparel unit.
Direct buyer question: How can footfall analytics help mall operators improve tenant mix? By showing which categories attract traffic, which categories convert that traffic, and which adjacencies encourage cross-shopping. Zone-level path analysis is especially useful for repositioning low-footfall areas into pop-ups, activations, kiosks, or destination concepts instead of leaving them as passive corridors.
This is also where integration matters. When corridor data is combined with tenant sales, operators can see which stores have strong exposure but weak conversion and then challenge layout, staffing, storefront visibility, or product assortment. For a deeper view of software capabilities, mall teams evaluating people counting analytics for retail and commercial spaces should prioritize dashboards that can compare zones, time periods, and tenant classes from one interface.
Operationally, the same analytics support non-leasing decisions. Real-time density by zone can inform cleaning frequency, guard deployment, queue response, and even energy controls, which is why visitor analytics increasingly sits alongside broader retail automation solutions rather than in a standalone reporting silo. Practical tip: review tenant mix decisions quarterly, not annually. Common mistake to avoid: relocating tenants based on one campaign spike or seasonal anomaly.
Step 5: Use footfall evidence in rental pricing, lease renewals, and ongoing optimization
Footfall data becomes financially powerful when it is translated into lease evidence. A mall operator can show that one frontage receives stronger passing traffic, better dwell time, and more event spillover than another apparently similar unit. That evidence supports premium rent for high-exposure corridors, stronger Common Area Maintenance discussions, and more disciplined incentives for secondary zones.
Direct buyer question: Can mall footfall data be used to justify higher rental pricing? Yes—provided the data is zone-specific, historically consistent, and clearly tied to commercial exposure. Landlords should present traffic trend lines, peak trading windows, dwell intensity, and anchor adjacency rather than relying on total mall entries, which are too broad for unit-level pricing.
A practical lease-renewal pack should include:
- Unit frontage traffic by month and trading day pattern
- Comparison with peer corridors and anchor routes
- Dwell characteristics of the surrounding zone
- Event uplift or seasonal uplift history
- Any tenant conversion benchmark available from POS integration
After go-live, build a regular governance cycle. Monthly reviews should involve leasing, operations, and marketing together, because rental pricing, campaign planning, and density management are connected. If the project also supports visitor analytics and smart occupancy monitoring in other commercial environments, the same governance model can usually be extended across mixed-use assets.
Practical tip: pair annual footfall trends with rolling 12-month zone comparisons to avoid overreacting to single-quarter shifts. Common mistake to avoid: using entrance totals alone to defend a unit-specific rent increase.
FAQ
Q: What is a shopping mall footfall counter and how does it work?
A: It is a sensor-based counting system installed at entrances or inside defined zones to measure visitor movement. Depending on the design, it may use 3D stereoscopic sensing, AI video, LiDAR, or Wi-Fi detection to produce traffic counts, directional flow, occupancy, and other behavioral metrics.
Q: How accurate are people counting systems in large shopping malls?
A: Accuracy depends on the technology, mounting conditions, calibration, and site complexity. Overhead 3D counters are generally preferred for exact corridor and entrance counting because they measure physical passage. Wi-Fi data is useful for supplementary journey analysis, but not usually as the sole source of precise traffic numbers.
Q: Are people counters reliable for lease negotiations?
A: Yes, if the deployment is designed around commercial zones and the data is consistently validated. Leasing teams should use historical trends, frontage traffic, directional flow, and dwell patterns rather than isolated daily spikes. Reliability comes from governance, not just hardware selection.
Q: Can mall footfall data be integrated with ERP and tenant POS systems?
A: In many enterprise deployments, yes. Integration allows operators to compare traffic with sales, campaign performance, and occupancy events. The key requirement is agreeing data ownership, refresh frequency, and KPI definitions so conversion analysis remains trusted by both landlord and tenant stakeholders.
Q: How does a mall-wide people counting system protect visitor privacy?
A: Most commercial footfall systems are designed to measure movement patterns and counts rather than identify individuals. Operators should still review local privacy requirements, define retention policies, limit access to analytics data, and ensure the chosen platform supports compliant deployment practices.
Q: What is the ROI of a footfall counting system for shopping centers?
A: ROI usually comes from better rent justification, improved tenant placement, reduced underused space, and more efficient staffing and facilities management. The strongest business case appears when traffic analytics is tied directly to leasing decisions and recurring operational actions, not treated as a passive reporting tool.
Mall operators that want a commercially useful deployment need more than devices—they need the right zone design, integration logic, and ongoing reporting structure. Technowave International delivers end-to-end FootfallCam solutions, implementation support, analytics integration, and local technical expertise to help malls convert traffic data into stronger tenant planning and rental decisions.
Related Articles
- How Footfall Analytics Helps Retailers in ABU DHABI Increase Sales
- Footfallcam Pro1 Ai Powered 2d Vision People Counter
- footfall Counter for Events: Guide for Smarter UAE Shows
- Footfall Counter for Retail: Why Every Store Needs It in 2025
- Ai Footfall Analytics V9
- Retail Insights with the 2025 AI Footfall Camera: The FootfallCam
Shopping Mall Footfall Counter for Rental Strategy
Learn how a shopping mall footfall counter helps improve tenant mix, zone planning, and rental pricing with actionable mall footfall analytics.